
At the heart of retail innovation: trusted by top global suppliers.
![]()
Insights to Impact
Make Every Data Point Count
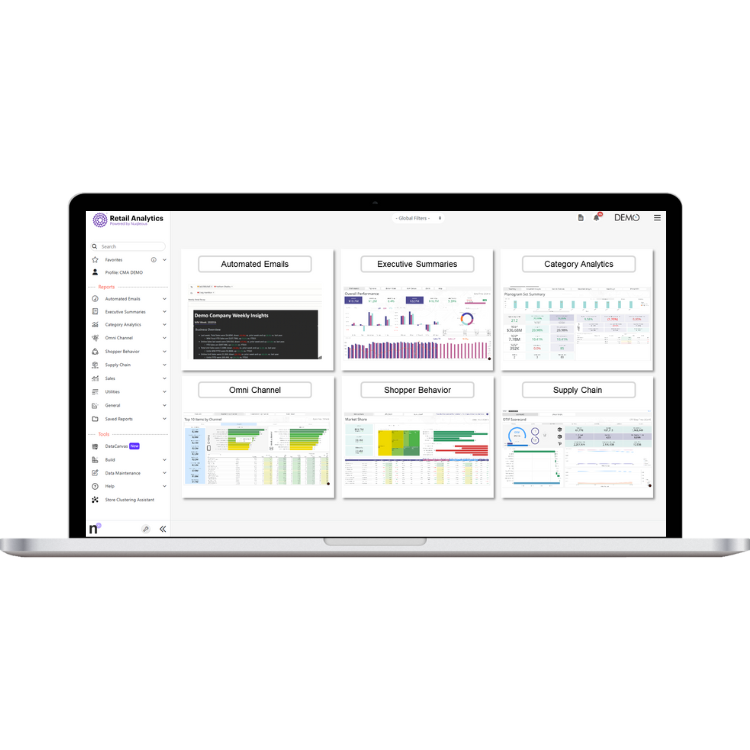
Our retail analytics platform works with Walmart Luminate data to streamline your decision-making process with advanced tools designed to simplify complex multi-source data analysis.
Leveraged by the world’s leading brands and top category advisors, our comprehensive solution aggregates and harmonizes data from multiple sources, transforming it into actionable insights allowing you to make swift, informed decisions that adapt to market dynamics.
![]()

Multi-Retailer Data Ingestion
| Automated & Managed Service Data Ingestion – Ensuring seamless data flow with expert oversight | |
| Harmonization & enrichment of retailer data across multiple sources | |
| Cross-retailer performance tracking for a single, unified view |


/Kellanova%20logo.svg)


Heading 1
with a request body that specifies how to map the columns of your import file to the associated CRM properties in HubSpot.... In the request JSON, define the import file details, including mapping the spreadsheet's columns to HubSpot data. Your request JSON should include the following fields:... entry for each column.

“We needed a space planning platform that’s flexible and user-friendly, one that could be adapted quickly to accommodate planograms in any one of our 20 categories. Shelf IQ® has been that solution.”
"The level of efficiency we gained with Spotlight was insane. From 3-4 hours down to 20 seconds."
Christine Rearick
Fruit of the Earth
Heading 1
with a request body that specifies how to map the columns of your import file to the associated CRM properties in HubSpot.... In the request JSON, define the import file details, including mapping the spreadsheet's columns to HubSpot data. Your request JSON should include the following fields:... entry for each column.

Fully Managed Service for Walmart Luminate Basic

Transform OPD Fulfillment, Surpass Expectations
Spotlight's in-depth analysis reveals actionable insights related to order fulfillment performance. Pinpoint lost sales opportunities and improved operational efficiency at the store level.
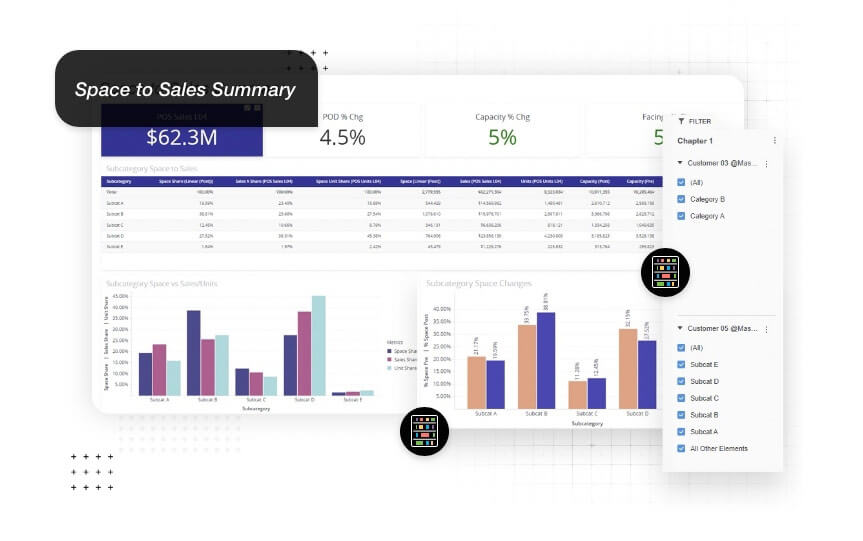
Maximize Shelf Potential with Planogram Insights
Boost category performance with a deeper understanding of shopper behavior. Nuqleous analytics unlocks insights at the item, store, day, and even shelf level for strategic optimization.


