
Chosen by Industry Leaders
![]()
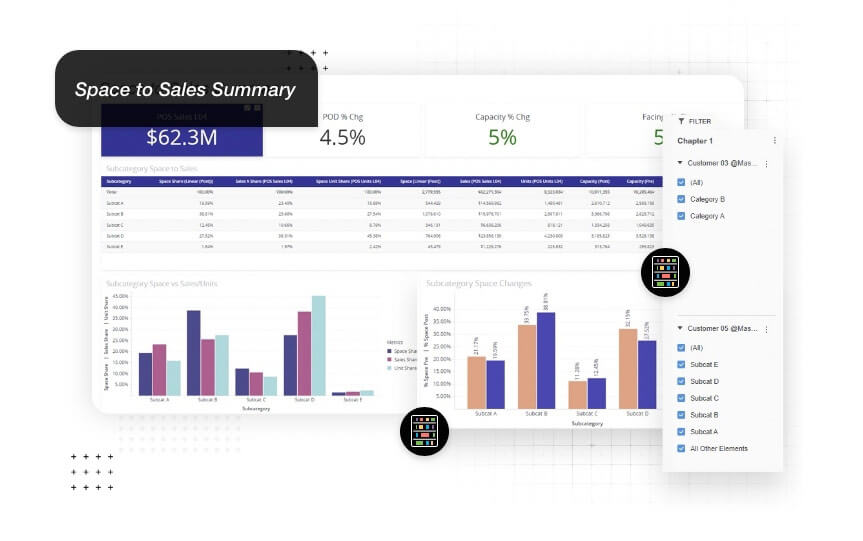
Insights to Impact
Make Every Data Point Count
Results IQ® retail analytics works Walmart data to streamline your decision-making process with advanced tools designed to simplify complex multi-source data analysis.
Leveraged by the world’s leading brands and top category advisors, our comprehensive solution aggregates and harmonizes data from multiple sources, transforming it into actionable insights allowing you to make swift, informed decisions that adapt to market dynamics.
![]()
Streamline Your Monday Routine
Whether it's on-demand reports or regular updates, Nuqleous ensures your entire team stays synchronized with the most up-to-date insights and data.
|
Customized Insights on Your Schedule: Insight Packs combine email notifications with detailed reports. Select your distribution lists, set preferences for daily or weekly reports, and ensure tailored insights reach the right stakeholders. |
|
|
Effortless Ad-Hoc Management: Meet Monday’s ad-hoc requests with ease. Build custom reports in any format—BI dashboards, Excel, PDFs, or mobile-friendly views—ensuring that stakeholders get exactly what they need in record time. |
|
|
AI-Powered Data Accuracy: Our AI model scans for potential issues, giving your team the chance to review and correct attributions before reports go live. |
|


Elevate Your Ad-Hoc Reporting and Research
Accelerate insights, respond quickly to requests, and dive deep into research with unparalleled efficiency.
Foster Collaboration and Build Trust with Nuqleous
Create a unified source of truth in your reporting, empowering effective collaboration and deeper conversations.
.png?width=750&height=750&name=Website%20Graphics%205%20(750%20x%20750%20px).png "Website Graphics 5 (750 x 750 px)")


Heading 1
with a request body that specifies how to map the columns of your import file to the associated CRM properties in HubSpot.... In the request JSON, define the import file details, including mapping the spreadsheet's columns to HubSpot data. Your request JSON should include the following fields:... entry for each column.

“We needed a space planning platform that’s flexible and user-friendly, one that could be adapted quickly to accommodate planograms in any one of our 20 categories. Shelf IQ® has been that solution.”
"The level of efficiency we gained with Spotlight was insane. From 3-4 hours down to 20 seconds."
Christine Rearick
Fruit of the Earth
Heading 1
with a request body that specifies how to map the columns of your import file to the associated CRM properties in HubSpot.... In the request JSON, define the import file details, including mapping the spreadsheet's columns to HubSpot data. Your request JSON should include the following fields:... entry for each column.
-26.png?width=750&name=Website%20Graphics%20(750%20x%20750%20px)-26.png "Website Graphics (750 x 750 px)-26")
Powerful Tools to Maximize Walmart Data Performance


Transform OPD Fulfillment, Surpass Expectations
Our in-depth analysis reveals actionable insights related to order fulfillment performance. Pinpoint lost sales opportunities and improved operational efficiency at the store level.
Maximize Shelf Potential with Planogram Insights
Boost category performance with a deeper understanding of shopper behavior. Nuqleous unlocks insights at the item, store, day, and even shelf level for strategic optimization.
